
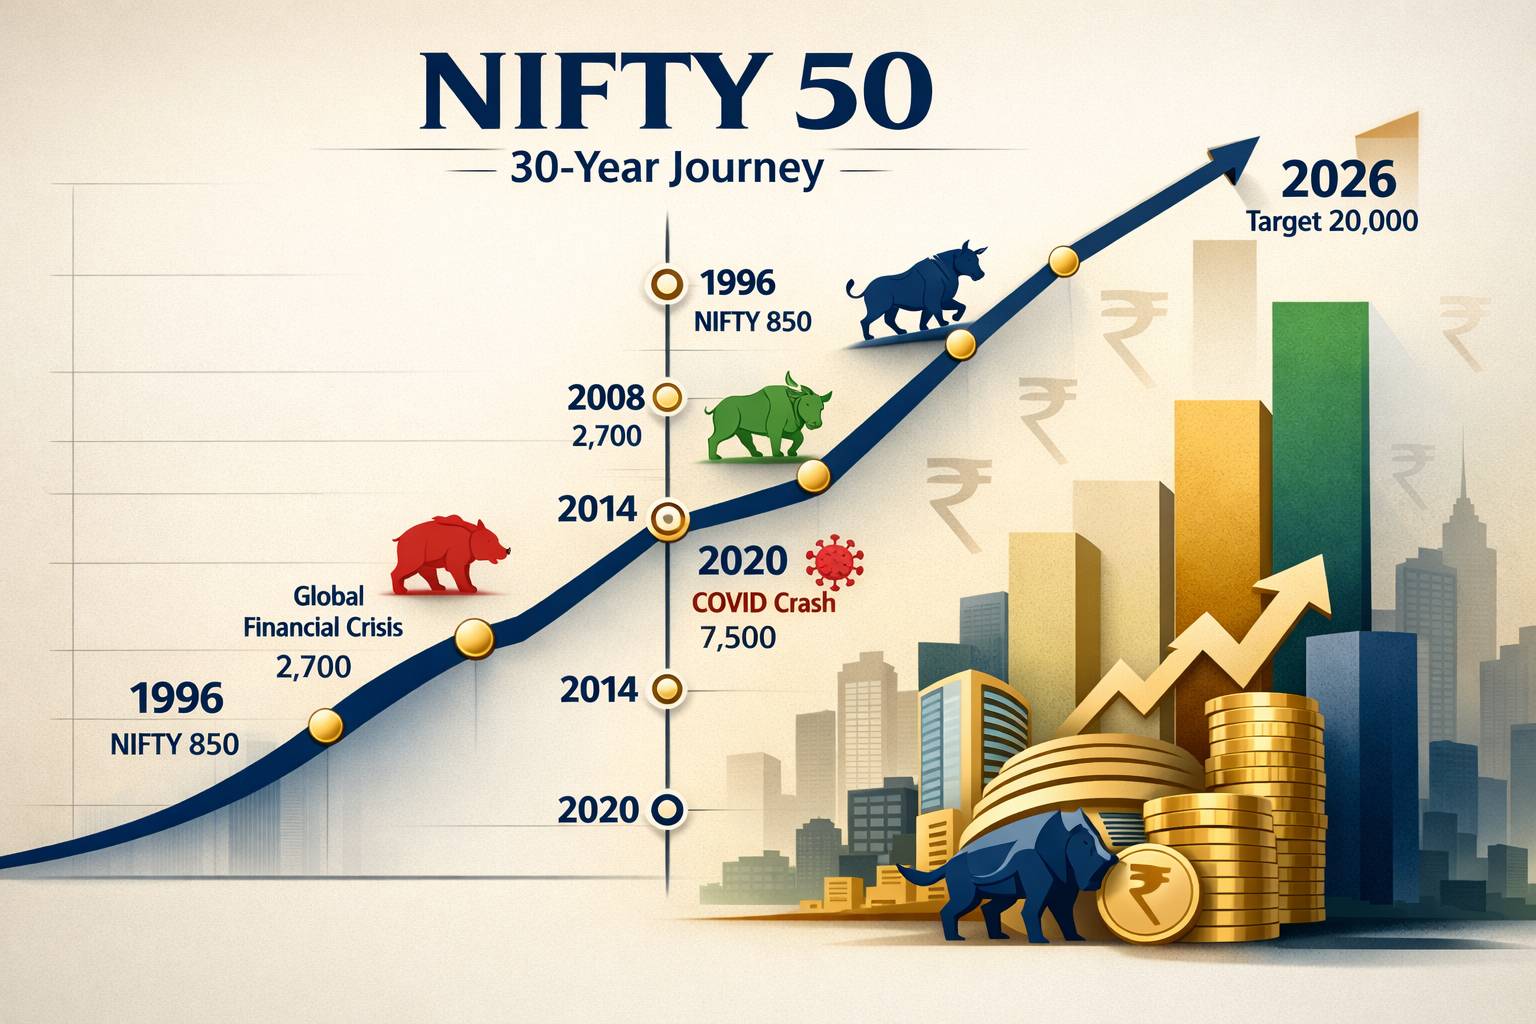
The NIFTY 50 was launched on 22 April 1996 with a base date of 3 November 1995 and a base value of 1,000. Over nearly three decades, it has grown to become the definitive barometer of the Indian equity market — tracking the 50 largest, most liquid companies listed on the NSE across 13 sectors of the economy. For long-term investors, understanding its historical behaviour is not just informative — it is essential.
The Growth Story: 1996–2026
What began at 1,000 has multiplied over 22 times. But the journey was far from linear — it included the dot-com bust, the 2008 global financial crisis, a COVID crash, and several periods of sideways consolidation. Yet through it all, the upward trajectory held.
Key Milestones
It took the Nifty almost 4 years to first touch 1,000 (Dec 1999), but the pace accelerated over time. Notice how the journey from 20,000 to 25,000 took just 11 months — a testament to the compounding power of a growing economy.
Calendar Year Returns
Annual returns reveal the volatility beneath the calm surface of long-term CAGR. The Nifty has delivered positive calendar-year returns in roughly 21 of 30 years (~70% of the time). The worst year was 2008 at −52%, and the best was 2009 at +76% — illustrating how dramatically markets can swing within a short span.
How Often Does Each Return Range Occur?
Looking at the distribution of calendar-year returns helps set realistic expectations. The most common outcome is a modest positive return in the 0–15% range — accounting for about 9 of the 30 years. Extreme gains (50%+) and extreme losses (30%+) are relatively rare but highly impactful.
Decade-Wise Performance & Wealth Creation
Across all three decades, the Nifty has delivered a remarkably consistent CAGR in the 10.5–11% range. This stability, despite vastly different macro environments (post-liberalisation, global financial crisis era, digital India era), speaks to the structural strength of Indian equity markets.
Major Bull & Bear Phases
Indian equity markets have always moved in cycles. The longest bull run lasted from October 2001 to January 2008, when the index rose from about 850 to over 6,200 — a gain of roughly 640%. The most severe bear phase was January 2008 to March 2009, a decline of approximately 60%. Understanding these cycles helps investors maintain perspective during turbulent times.
Rolling Returns: The Power of Patience
This is perhaps the most important chart for long-term investors. As the holding period increases, the range of returns narrows dramatically. At a 1-year horizon, returns have ranged from −52% to +78%. But at a 7-year horizon, Nifty 50 has never delivered a negative CAGR across any rolling window in its entire history.
Current Sector Composition
The Nifty 50 today is dominated by Financial Services (including banking) at nearly 37% weight, followed by Oil & Gas at about 10.4% and Information Technology at 10.2%. The sectoral mix has evolved significantly over the decades — from a manufacturing-heavy economy to one driven by services, technology, and financial intermediation.
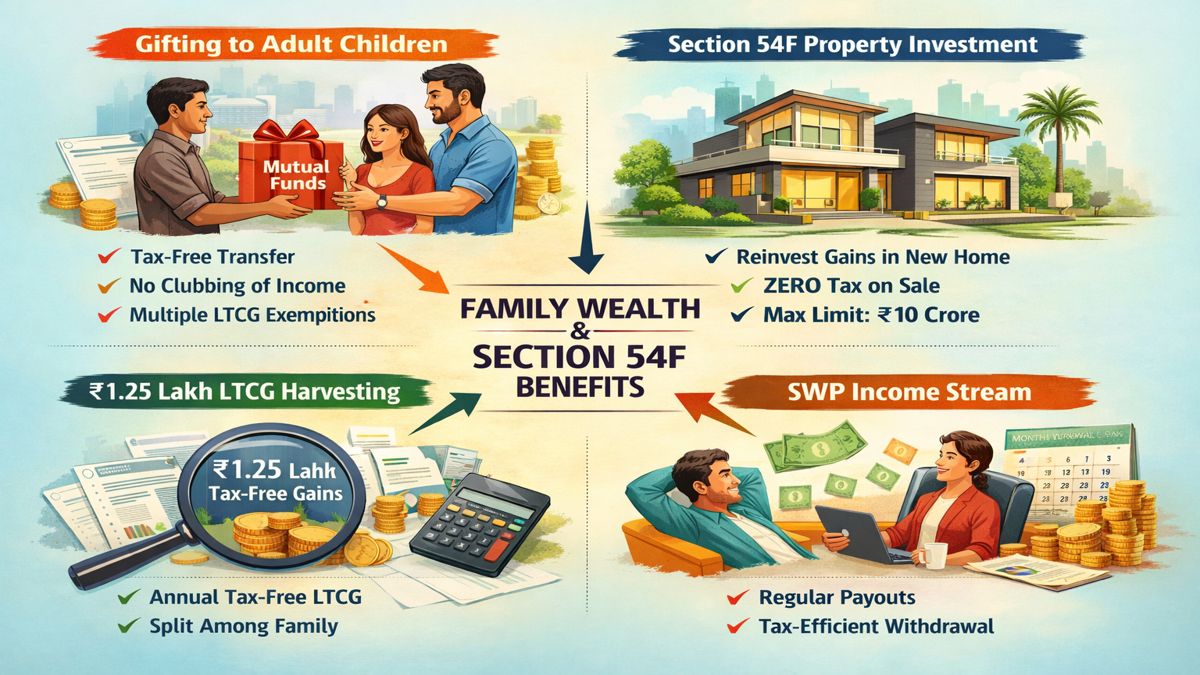
What This Means For You
The Nifty 50's three-decade track record teaches us several enduring lessons. Equity investing rewards patience — the longer you stay, the more predictable your returns become. Short-term volatility is the price of admission for long-term wealth creation. And systematic investing through SIPs smooths out these fluctuations even further.
As your mutual fund distributor, we at CognityWealth believe in these principles. Whether you are building wealth through index funds, actively managed large-cap funds, or multi-asset strategies — the foundational truth remains the same: time in the market, not timing the market, is what generates wealth.